Cascading search#
In the Quickstart notebook we covered searching datasets one-by-one and gradually reducing the spatial domain of our search based on overlapping footprints.
coincident also provides a cascading_search()[#coincident.search.cascading_search] method as a convenience to perform this same type of search in one go.
import coincident
import geopandas as gpd
import xyzservices.providers as xyz
import matplotlib.pyplot as plt
/home/docs/checkouts/readthedocs.org/user_builds/coincident/checkouts/104/src/coincident/io/download.py:27: TqdmExperimentalWarning: Using `tqdm.autonotebook.tqdm` in notebook mode. Use `tqdm.tqdm` instead to force console mode (e.g. in jupyter console)
  from tqdm.autonotebook import tqdm
%matplotlib inline
# %config InlineBackend.figure_format = 'retina'
Identify a primary dataset#
Start by loading a full resolution polygon of a 3DEP LiDAR workunit which has a known start_datetime and end_datatime:
workunit = "CO_WestCentral_2019"
df_wesm = coincident.search.wesm.read_wesm_csv()
gf_lidar = coincident.search.wesm.load_by_fid(
    df_wesm[df_wesm.workunit == workunit].index
)
gf_lidar
| workunit | workunit_id | project | project_id | start_datetime | end_datetime | ql | spec | p_method | dem_gsd_meters | ... | seamless_category | seamless_reason | lpc_link | sourcedem_link | metadata_link | geometry | collection | datetime | dayofyear | duration | |
|---|---|---|---|---|---|---|---|---|---|---|---|---|---|---|---|---|---|---|---|---|---|
| 0 | CO_WestCentral_2019 | 175984 | CO_WestCentral_2019_A19 | 175987 | 2019-08-21 | 2019-09-19 | QL 2 | USGS Lidar Base Specification 1.3 | linear-mode lidar | 1.0 | ... | Meets | Meets 3DEP seamless DEM requirements | https://rockyweb.usgs.gov/vdelivery/Datasets/S... | http://prd-tnm.s3.amazonaws.com/index.html?pre... | http://prd-tnm.s3.amazonaws.com/index.html?pre... | MULTIPOLYGON (((-106.17143 38.42061, -106.3208... | 3DEP | 2019-09-04 12:00:00 | 247 | 29 |
1 rows × 33 columns
Search secondary datasets#
Provide a list that will be searched in order. The list contains tuples of dataset aliases and the temporal pad in days to search before the primary dataset start and end dates
secondary_datasets = [
    ("maxar", 14),  # +/- 14 days from lidar
    ("gedi", 40),  # +/- 40 days from lidar
    ("icesat-2", 60),
]

dataframes = coincident.search.cascading_search(
    gf_lidar,
    secondary_datasets,
    min_overlap_area=30,  # km^2
)
Visualize results#
Below we visualize cropped footprints from each secondary dataset.
gf_maxar = dataframes[0]
print(len(gf_maxar))
m = gf_lidar.explore(
    style_kwds=dict(fill=None, color="black"), tiles=xyz.CartoDB.Positron
)  # basemap
gf_maxar.explore(m=m, column="datetime")
7
gf_gedi = dataframes[1]
print(len(gf_gedi))
m = gf_lidar.explore(
    style_kwds=dict(fill=None, color="black"), tiles=xyz.CartoDB.Positron
)  # basemap
gf_gedi.explore(m=m, column="datetime")
14
gf_is2 = dataframes[2]
print(len(gf_maxar))
m = gf_lidar.explore(
    style_kwds=dict(fill=None, color="black"), tiles=xyz.CartoDB.Positron
)  # basemap
gf_is2.explore(m=m, column="datetime")
7
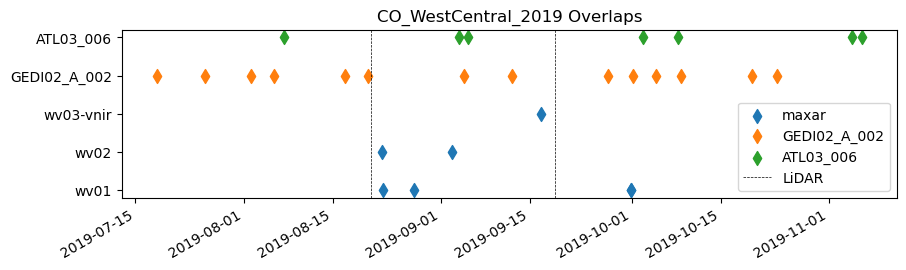
fig, ax = plt.subplots(figsize=(10, 5))
for df in dataframes:
    if "constellation" in df.columns:
        label = df.constellation.iloc[0]
    else:
        label = df.collection.iloc[0]
    plt.scatter(x=df["datetime"], y=df["collection"], s=50, marker="d", label=label)

# NOTE: probably a more robust way to set aspect depending on date range
ax.set_aspect(6)
plt.axvline(
    gf_lidar.start_datetime.iloc[0],
    color="black",
    linestyle="--",
    linewidth=0.5,
    label="LiDAR",
)
plt.axvline(gf_lidar.end_datetime.iloc[0], color="black", linestyle="--", linewidth=0.5)
plt.title("CO_WestCentral_2019 Overlaps")
plt.legend(loc="lower right")
fig.autofmt_xdate()
Save results#
The footprints of the last secondary dataset show where we have spatial intersections across all datasets. We save this a single MultiPolygon to use in QGIS or geojson.io
gf_is2.dissolve()[["geometry"]].to_file("/tmp/CO_WestCentral_2019_overlaps.geojson")
Summary#
The CO_WestCentral_2019 USGS 3DEP LiDAR was acquired between 2019-08-21 and 2019-09-19
We found 7 Maxar Stereo acquisitions with 14 days of the LiDAR
We found 14 GEDI acquisitions that overlap the lidar+stereo footprints within 40 days of LiDAR
We found 7 ICESat-2 acquisitions that overlap combined lidar+stereo+GEDI footprints within 60 days of LiDAR
The final ‘overlap’ polygons have at least a 30k^2 area in which at least two of the datasets intersect. Acquisition dates for any given footprint vary from 60 days before the LiDAR was acquired through 60 days afterwards.